

GEODATA FOR MARKETING, SALES & EXPANSION
Use your advertising budget effectively.
Make informed location decisions.
Measure frequencies – Understand visitor structures – Evaluate catchment areas – Recognize white spots – Activate potentials
Location decisions, local campaigns and expansion plans are often based on incomplete information. Capaneo makes movements at locations, events, branches, competitive environments and relevant points of interest analyzable – as a concrete basis for better decisions in marketing, sales and expansion.
With our geodata solutions, you can identify where people are actually out and about, which locations generate footfall, which catchment areas visitors come from and where untapped market potential is emerging.
Geodata doesn’t just show places – it shows potential
 Where do relevant contacts arise? Which locations actually attract visitors? Where are there target groups that you are not yet reaching? And which regions are particularly attractive for sales, media or expansion?
Capaneo combines mobility and location signals with analytical data expertise. This results in usable geo-insights: for the evaluation of individual locations, the comparison of branches, the analysis of events, the prioritization of new sales areas or the identification of untapped market potential.
Four areas of application for geodata:

Measure frequency:
How many people are really on site?
Recognize visitor traffic by location, period, day of the week or time – for example for branches, events, trade fairs, sports venues or competitive environments.

Understanding visitors:
Which target groups are in the area?
Analyze visitor structures, areas of origin, socio-demographic characteristics and relevant behavioral patterns – aggregated and tailored to the issue at hand.

Recognize potential:
Where are the opportunities for growth?
Identify white spots, underserved regions, attractive catchment areas and locations with high market potential.

Derive measures:
Which action is worthwhile where?
Use geo-insights for campaigns, location decisions, sales prioritization, branch planning or local activation.
Where geodata creates immediate value
EVENT & FREQUENCY MEASUREMENT: How many people were really there?
Using polygonal geofences, Capaneo analyzes how many people spent time in defined areas — for example around events, exhibition spaces, branches or promotional areas. Different zones such as Outer, Middle and Inner Fence show how many visitors were only nearby and how many actually entered the relevant core area.
Possible analyses:
Total footfall · Frequency by day and time · Heatmap · Zone comparison · Event comparison · Location comparison
Benefits:
Better budget planning, reliable event evaluation, more efficient staff planning, more concrete ROI assessment.

VISITOR & TARGET GROUP PROFILES: Who visits your locations, events or environments?
Frequency alone does not yet explain which target groups are being reached. Aggregated profile analyses provide a better understanding of visitor structures — for example by areas of origin, residential environment, consumer affinities, lifestyle indicators or relevant behavioral patterns.
Possible analyses:
Homebase analysis · Visitor profile · Comparison with reference groups · Target group segments · Lookalike potentials
Benefits:
Better assortment decisions, more relevant communication, more precise media and campaign planning.

ACCESS AREAS & FILIAL NETWORKS: Where do visitors come from – and which areas do you not reach?
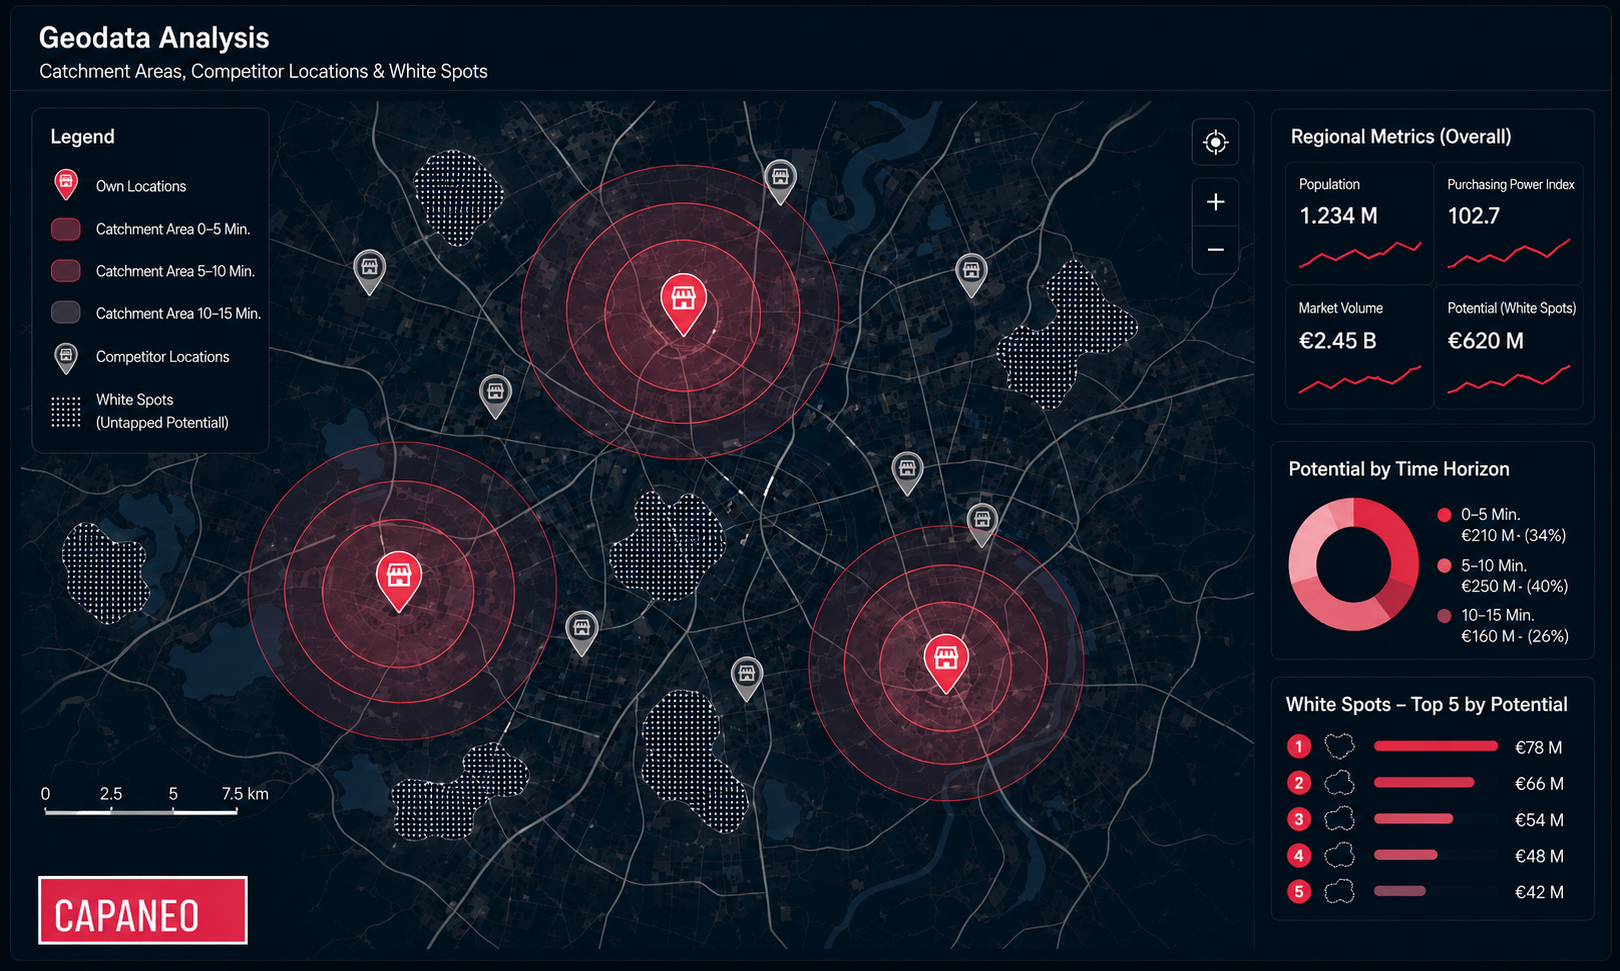
Catchment area analyses show which regions actually contribute to a location’s performance. This makes branch territories, sales radii, regional advertising areas and location overlaps easier to evaluate.
Possible analyses:
Catchment area map · Postal code / cell potentials · Location comparison · Cannibalization analysis · Regional target group distribution
Benefits:
Better branch management, less wasted reach, more precise regional sales and marketing measures.

COMPETITION & POINTS OF INTEREST: Where are your potential new customers?
Relevant target groups do not only move around your own locations. They visit competitors, sports facilities, leisure venues, shopping centers, mobility hubs or other points of interest. Capaneo makes these environments analyzable and shows where additional target group potential emerges.
Possible POIs:
Competitor locations · Sports facilities · Fitness studios · Swimming pools · Climbing and bike parks · Tennis and padel halls · Shopping areas · Leisure and event spaces · and much more
Benefits:
Identify new target group sources, evaluate competitive environments, plan local campaigns more effectively.

WHITE SPOTS & EXPANSION: Where is growth really worthwhile?
By combining mobility indicators, target group characteristics, competitive pressure and existing market coverage, regions become visible where potential has not yet been fully tapped. This results in prioritized lists and maps for expansion, sales development or local activation.
Possible analyses:
White spot map · Market potential score · Competitive overlay · Existing customer matching · Location recommendation · Regional prioritization
Benefits:
Data-driven expansion decisions, better resource allocation, clearer priorities for sales and marketing.

CAMPAIGNS & ACTIVATION: How do geo-insights become measurable measures?
Concrete measures can be derived from geo-analyses: local media selections, regional direct marketing campaigns, digital target group activation, location communication or visit impact measurement. Depending on the project setup, analysis, audience building and activation can be connected with one another.
Possible analyses and measures:
Local target group selection · Regional campaign planning · Visit impact measurement · Control group logic · Lookalike approaches · Retargeting-related activation with the right setup
Benefits:
Less wasted reach, more precise targeting, better measurability of local marketing measures.

Du möchtest wissen, welche bewegungsbasierten Zielgruppen für Deine Kampagne möglich sind?
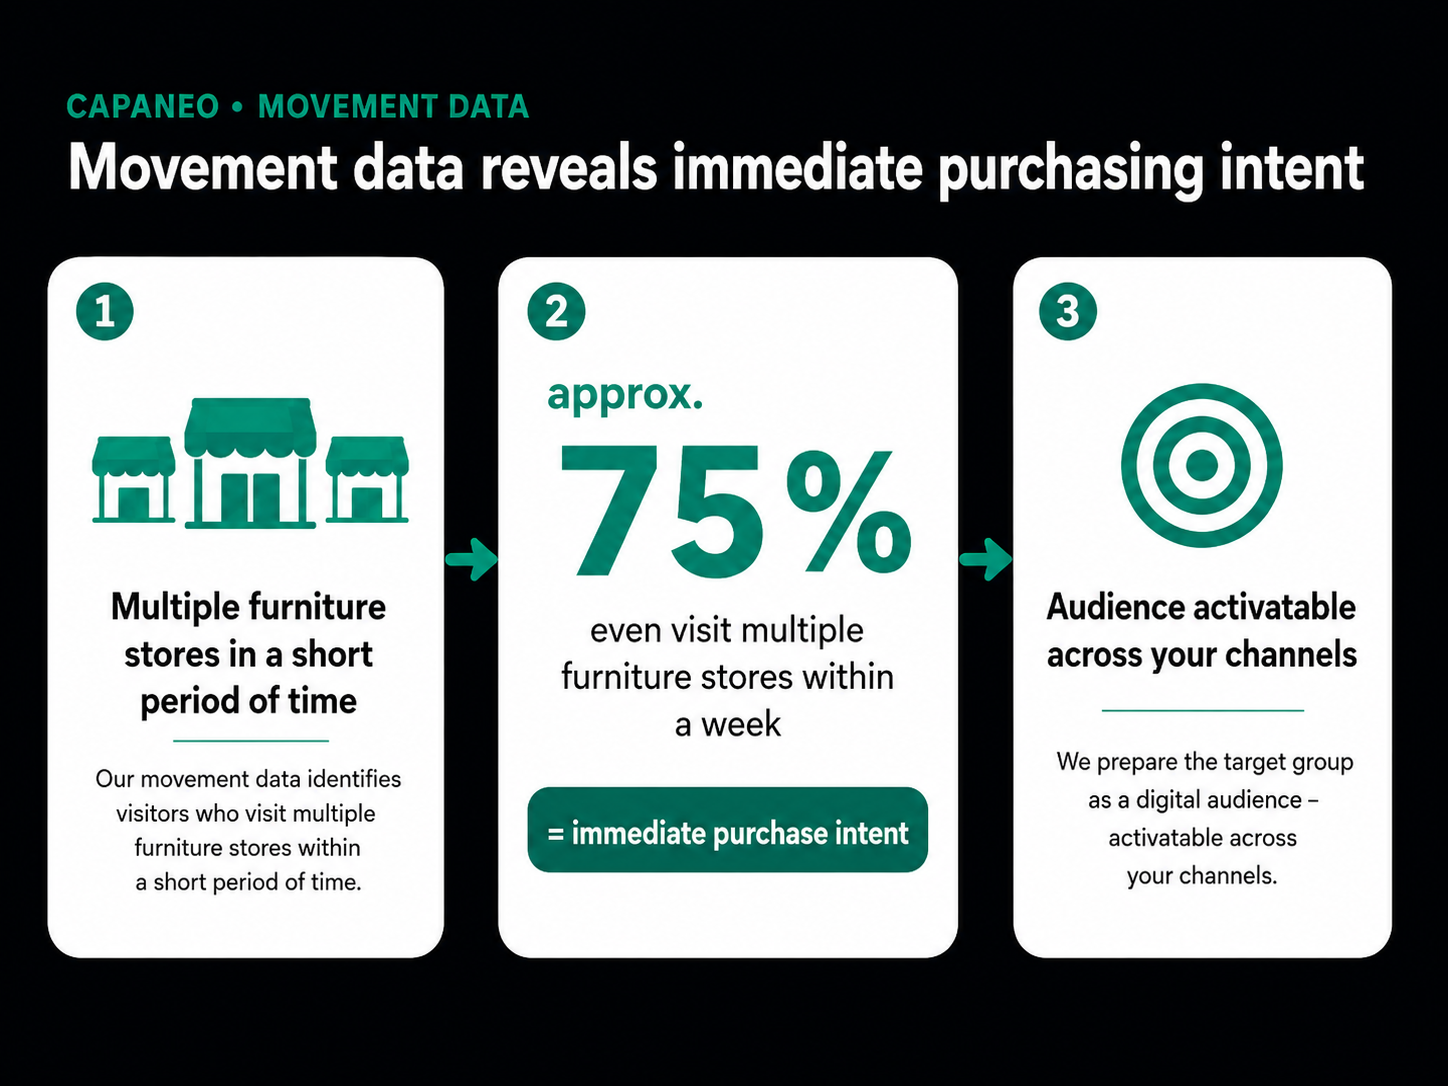
From Geo-Insight to an activatable target group
Geo-analyses do more than just show where people are going. They can also reveal which target groups emerge based on their actual behavior—for example, by visiting specific locations, events, competitor stores, or relevant points of interest.
This is precisely what gives rise to target groups that often cannot be identified using traditional databases. That’s because those databases typically only contain information about who someone is or where they live. Geodata adds a crucial dimension to this picture: where people actually go and which places they actively visit.

For example, this allows you to create target groups such as:
Depending on the project setup, data source, and data protection framework, these target groups can be used for cross-channel campaigns . Possible applications include digital audience activation, regional media selections, social and display campaigns, direct marketing, retail media approaches, or integration with existing CRM and first-party data.
The advantage: Campaigns are no longer planned solely based on sociodemographic characteristics, interests, or existing data. They are also based on actual location and movement patterns. This turns a geo-analysis into a concrete foundation for marketing, sales, and local communication—reaching target groups that would be difficult or impossible to select using traditional methods.
How to turn movement into a resilient market signal
Data Protection & Governance
The collection and processing of our geodata are carried out in strict compliance with data protection regulations.
Many questions related to geodata can be answered using aggregated results. In these cases, you will not receive individual mobile identifiers or personal movement profiles, but rather aggregated analyses, maps, scores, or indicators.
If a project requires deeper data integration, the purpose, scope of data, allocation of roles, technical handover, and contractual documentation are clearly defined before the project begins.

Which decisions do you want to make better with geodata?
Geodata always helps when decisions are spatial, local or location-based. Capaneo translates movement and location signals into answers that can be used for marketing, sales, expansion and strategy.
LOCATIONS & FILIALS: How are my locations really performing?
- How high is the visitor frequency at individual locations?
- Which catchment areas do visitors come from?
- Which locations have strong overlaps or cannibalization effects?
- Where is local advertising particularly worthwhile?
EVENTS & TRADE FAIRS: Who was really there?
- How many visitors did an event have?
- When were the strongest day and time windows?
- Which areas on the site were particularly frequented?
- Which visitor profiles can be recognized in aggregated form?
COMPETITION & POI: Where do relevant target groups move outside my own locations?
- Which competitor locations attract similar target groups?
- Which sports facilities, leisure locations, shopping areas or mobility hubs are relevant?
- Where is there target group potential that is not yet visible in your own CRM?
EXPANSION & WHITE SPOTS: Where are new market opportunities emerging?
- Which regions have high potential with low market penetration?
- Where are there attractive target group structures but little competition?
- Which zip code areas, sales regions or micro-locations should be prioritized?
How the geodata gets into your systems
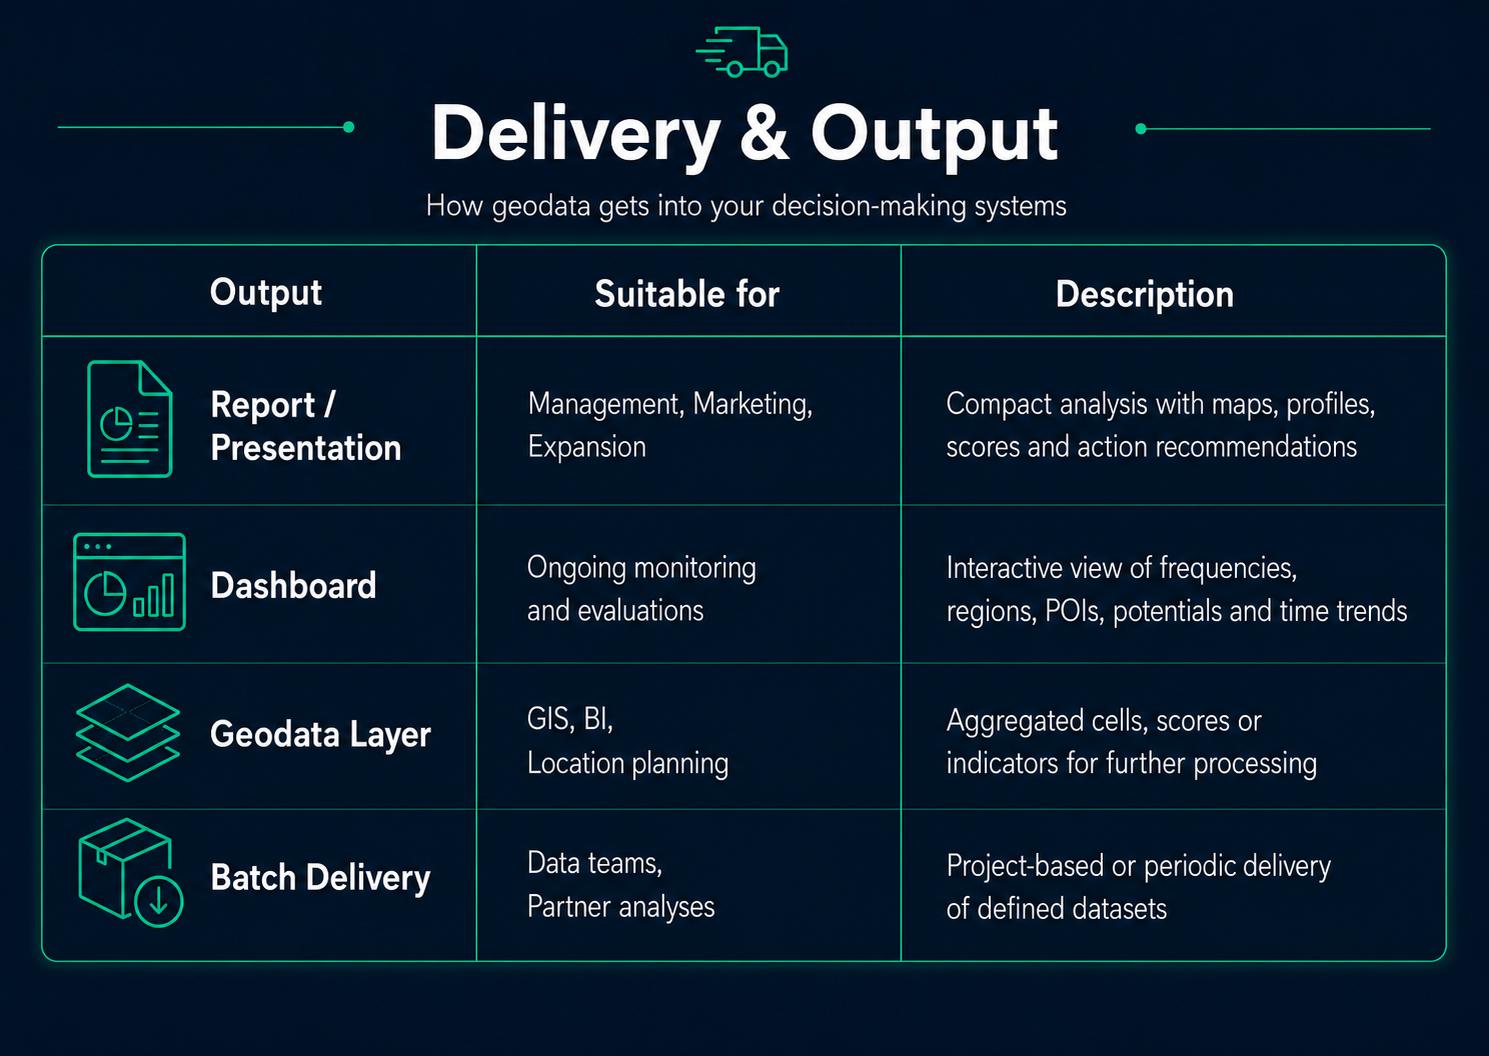
Capaneo does not deliver geodata as an end in itself, but in the form in which you can use it: as a management report, dashboard, geodata layer or batch file. The appropriate output depends on the question, data scope, update frequency and technical environment.



Your questions about geodata
What is geodata at Capaneo?
Geodata is location, mobility and environmental information that helps to understand spatial behavior and regional potential. Capaneo uses this data to analyze visitor flows, catchment areas, target group profiles, competitive environments and market opportunities.
How is data protection taken into account?
The data output is defined according to the research question and the governance model. Many projects work with aggregated results. In the case of deeper data integration, roles, purposes, transfer paths and contractual documentation are clarified before the project starts.
What are geo-analyses suitable for?
Geo-analyses are suitable for location evaluations, event analyses, store comparisons, competitive analyses, catchment area evaluations, white spot analyses, expansion planning and local campaign management.
Do I need my own customer data?
Not always. Location profiling and aggregated geodata analyses can be carried out without your own customer data. If you bring in your CRM, sales or location data, potentials can be modeled even more precisely.
Can geo-insights also be used for campaigns?
Yes, depending on the project setup, geo-insights can be translated into target groups, regional selections, media planning, direct marketing or digital activation. Which form makes sense and is possible depends on the objective, database, channel and data protection setup.
How quickly can a geodata project start?
This depends on the number of locations or regions, observation period, desired output and technical integration. A clearly defined location profiling project can start much leaner than a data fusion or data feed setup with multiple data sources.